
From Unsolicited Offers to a Competitive Process
“Looking back, the process delivered a meaningfully better result than what we would have achieved handling inbound interest on our…

We review hundreds of management presentations each year, and almost all of them promote a seemingly important number: Revenue per Employee. We hear exciting figures like “$300K per employee!” “$800K per employee!” “$1.5M per employee!” Sounds great, right? Not so fast.
For investors, relying on this metric to gauge the potential of a portfolio company is risky at best. Using Revenue per Employee to predict profitability is like using miles per gallon as a metric to predict the resale value of a car. Under rare circumstances these two might be correlated, but often the relationship is trivial at best. RPE is seldom predictive of future growth or profitability. Not all revenue is created equally, and not all employees are paid equally.
However, there is an alternative KPI which can more accurately help predict profitability, what we call the Strategex Key Ratio. Here’s how it works:
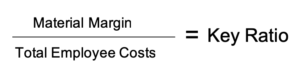
In the numerator, use material margin (or equivalent) rather than revenue. This is what a business has left over to convert materials into a product, pay for SG&A, and ultimately realize a profit. In other words, material margin represents the potential for value creation, whereas revenue as a numerator falsely assumes all our top line can flow through to the bottom line.
In the denominator, substitute the number of employees for total employee costs. Ultimately, the number of employees is unimportant. What it costs to enable those employees to do their jobs, however, is extremely important. Since we pay people more than just wages, total employee costs should include all people-related expenses: salary, commissions and bonuses, benefits, phone reimbursements, payroll processing, recruiting costs, professional development, charitable gift matching, travel and entertainment, payroll taxes, etc.
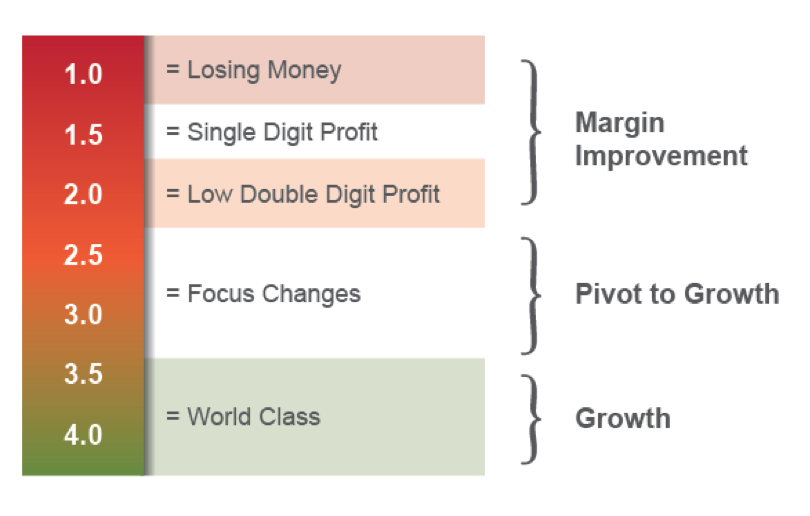
This equation results in a telling snapshot of the state of a business. For example, if there is a 1:1 relationship between material margin and employee cost (a Key Ratio of 1.0), the company must be losing money, since operating income will fall below zero after subtracting non-employee related costs. Conversely, a company with a 4:1 relationship between material margin and employee costs is probably doubling EBITDA every few years because it is highly effective at leveraging its human capital.
This ratio not only provides a snapshot of the financial health of a business, it also provides direction on where efforts should be directed to accelerate and sustain EBITDA growth:
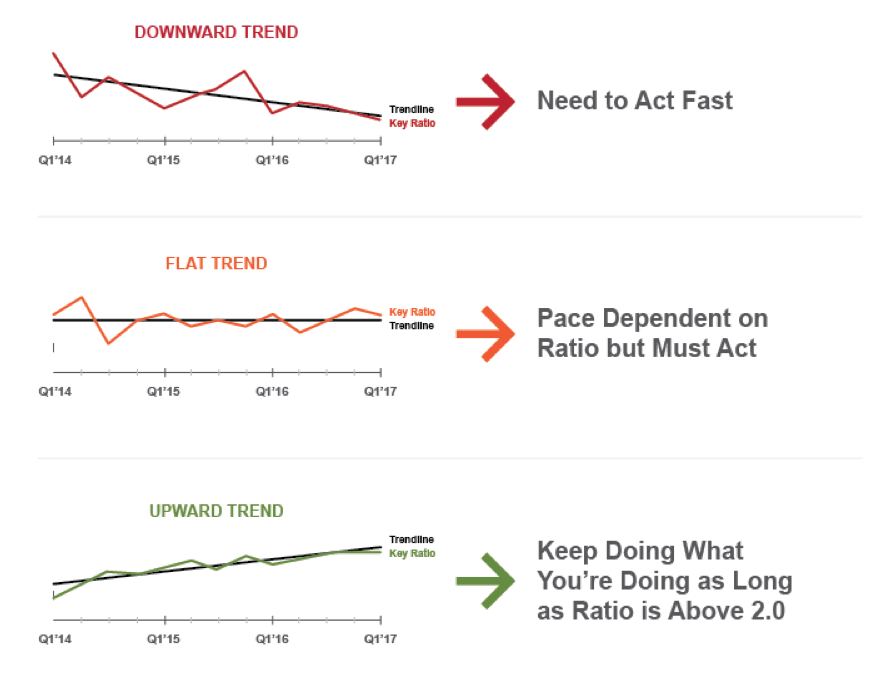
As powerful as this single data point can be, it probably doesn’t tell the whole story. Therefore, we always encourage clients to look at the Key Ratio trends over 16 quarters.
Curious what the trend for one of your portfolio companies looks like? If you’re an Axial member, we’ll crunch the data for you and provide a complimentary assessment. Capacity is limited.