The SMB M&A Pipeline: Q4 2025
Welcome to the Q4 2025 issue of The SMB M&A Pipeline, the quarterly series that surfaces a top-of-the-funnel breakdown of…

Private equity firms miss the majority of opportunities available in the market. According to Sutton’s annual Private Equity Deal Origination Benchmarking Report (snapshot below), PE firms, on average, cover less than 20% of relevant deal flow coming from lower middle market advisory firms. Even firms in the top quartile only reach 27.5%, and at the very best, market leaders max out at 57.1%.
Deals Sourced
NDAs Signed
New Advisor Relationships
% Coverage Increase
PE Firm #1
3,681
421
1,828
36.56%
PE Firm #2
1,204
133
791
24.08%
PE Firm #3
714
64
517
10.34%
In this piece, we unpack how Axial expands private equity deal sourcing coverage, enabling firms to uncover opportunities that standard sourcing methods miss. The table above highlights three real PE firms and their annual Axial deal funnels, which we break down later in the article. This expanded coverage is powered by Axial’s deal sourcing engine, which combines technology, marketing, and business development to extend members’ coverage to the long tail of lower middle market sell-side M&A advisors.

This limited deal coverage is driven by several challenges. Most advisors are generalists, so industry-specific opportunities surface only occasionally. Advisors are difficult to find, since small firms are rarely in databases and most transactions go unpublicized. The market is highly fragmented, with more than 5,000 boutique investment banks that no BD team can realistically cover.
Private equity investors turn to Axial to expand their coverage of relevant deal flow from lower middle market boutique investment banks and business brokers. Some quick stats on the platform:
| Coverage | Active Advisors | Annual Deal Flow | Location | Revenue Range | EBITDA Range |
| ~50% of LMM advisors | 2,500+ | 11,000+ | US & Canada | $3M - $250M | $500K - $25M |
Axial’s membership includes PE funds of all sizes, executing different strategies based on their scale. Below, we break down the annual deal flow of three real private equity firms—at the 10-figure, 9-figure, and 8-figure fund levels—that leverage the Axial platform to expand their coverage, reviewing thousands of opportunities they would not otherwise see.
| Deals Sourced | Unique Firms | Investment Banks | Business Brokers | Average Revenue | Average EBITDA |
| 3,681 | 1,828 | 54.5% | 45.5% | $13,156,502 | $2,164,163 |
| Industry Breakdown | |||||
| Consumer Goods - 94.89% | Industrials - 4.32% | Transportation - 0.49% | Business Services - 0.30% | |||||
| NDAs Signed | Unique Firms | Investment Banks | Business Brokers | Average Revenue | Average EBITDA |
| 421 | 386 | 88.6% | 11.4% | $20,433,195 | $3,511,792 |
| Industry Breakdown | |||||
| Consumer Goods - 96.43% | Industrials - 2.85% | Transportation - 0.48% | Business Services - 0.24% | |||||
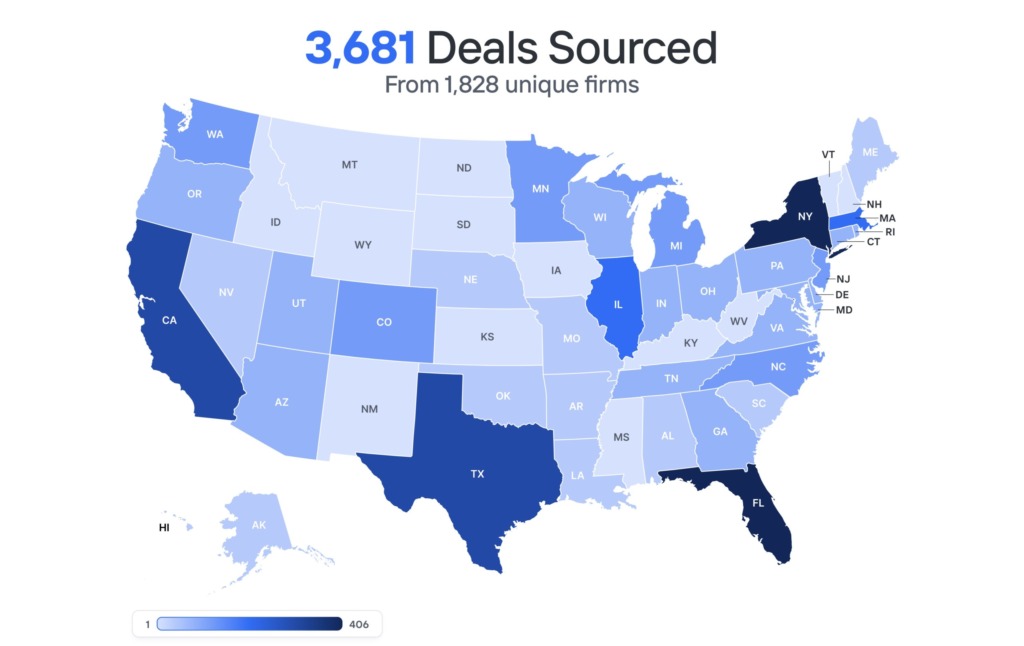
This PE fund is a team of 15+ people. Their latest fund was in the $300M to $350M range, and their current and past investment portfolios include 75-100 companies. With a target investment size between $5M and $25M, the firm focuses on scalable, service-based companies in a range of niche industries. The firm has been an Axial member since 2010, leveraging the platform to source both add-on and platform investment opportunities, and has successfully closed four transactions through Axial.
| Deals Sourced | Unique Firms | Investment Banks | Business Brokers | Average Revenue | Average EBITDA |
| 1,204 | 791 | 66.95% | 33.05% | $20,694,922 | $3,612,109 |
| Industry Breakdown | |||||
| Industrials - 65.20% | Technology - 28.65% | Healthcare - 4.15% | Business Services - 1.25% | |||||
| NDAs Signed | Unique Firms | Investment Banks | Business Brokers | Average Revenue | Average EBITDA |
| 133 | 123 | 70.45% | 29.55% | $20,579,071 | $3,604,476 |
| Industry Breakdown | |||||
| Industrials - 73.68% | Technology - 15.79% | Healthcare - 5.26% | Business Services - 3.01% | |||||
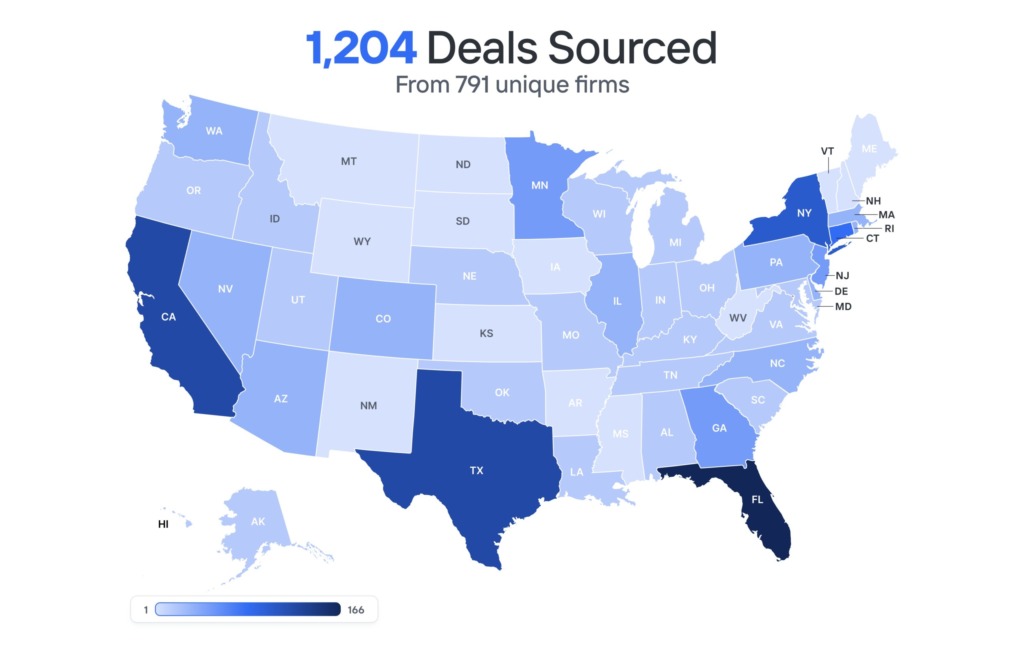
This PE fund employs more than 60 employees. Its latest fund was in the $1–2 billion range, and the firm currently manages 20-25 active portfolio companies with more than 10 successful exits. The firm focuses on consumer and business services sectors, with core investments spanning food and beverage, health and wellness, automotive, and residential services. The team primarily uses Axial to source add-on acquisitions for its portfolio companies, with EBITDA between $3M and $10M, and, secondarily, to identify platform investments with EBITDA above $10M.
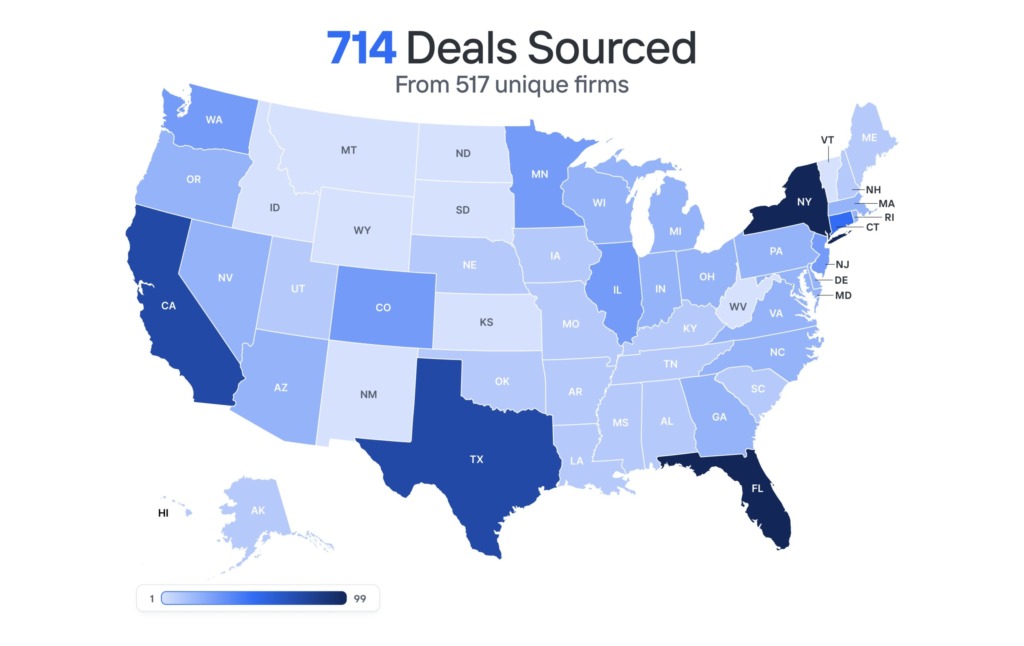
| Deals Sourced | Unique Firms | Investment Banks | Business Brokers | Average Revenue | Average EBITDA |
| 714 | 517 | 59.90% | 20.1% | $72,862,758 | $3,676,288 |
| Industry Breakdown | |||||
| Industrials - 51.96% | Education - 20.73% | Food & Hospitality - 13.87% | Healthcare - 13.45% | |||||
| NDAs Signed | Unique Firms | Investment Banks | Business Brokers | Average Revenue | Average EBITDA |
| 64 | 64 | 64.50% | 35.50% | $21,696,698 | $4,555,301 |
| Industry Breakdown | |||||
| Industrials - 78.13% | Education - 7.81% | Food & Hospitality - 10.94% | Healthcare - 3.13% | |||||


In a market where most private equity funds still engage with only a fraction of available opportunities, Axial is helping investors meaningfully widen their reach. By connecting firms to the overlooked segment of the lower middle market, Axial enables deal teams to establish new advisor relationships, uncover proprietary opportunities, and strengthen their origination pipelines. The data shows that Axial PE members are expanding coverage by 10–37%, sourcing from a broader and more diverse advisor network than ever before. For funds competing in an increasingly crowded market, this expanded visibility can be the difference between missing a deal and closing one.