Eliot Kerlin and Broadwing: Principles over Playbooks
Today’s guest is Eliot Kerlin, Founder and Managing Partner of Broadwing Capital. With 25 years of experience in the lower…

Most successful businesses adopt both organic and inorganic growth strategies. And add-on acquisitions remain one of the most widely used inorganic growth strategies for investor-owned and founder-owned companies alike.
Sourcing add-on acquisitions is one of the primary reasons why firms join Axial. The majority of great add-on targets fall within the $500K – $5M EBITDA range, and are represented by one of the 5,000 – 10,000 boutique investment banks and brokers in the lower middle market.
Given the fragmentation of advisors in this size range, as well as the lack of industry specialization, it is nearly impossible to cover the market of relevant add-on opportunities without the help of a software tool to help cut through the noise.
On Axial, it’s not just the private equity firms or strategic buyers hunting for add-ons. In contrast, almost every one of the core buyer types on the platform —Private Equity, Independent Sponsors, Family Offices, Holding Companies, Corporations, and even Individual Investors—actively set up projects to source add-on opportunities.
In the piece below, we’ve included some case studies, product details, and a host of Axial data to help contextualize the add-on activity taking place on the platform.
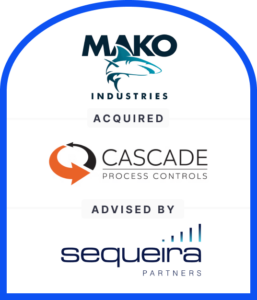
Shortly after joining Axial, Mako Industries, a Texas Corporation, launched a targeted buyside project in pursuit of strategic add-on acquisitions—and quickly identified Cascade Process Controls as a fit. Brought to market by Sequeira Partners, Axial member since 2016, CPC aligned with Mako’s goal of expanding its service capabilities and national footprint.
The deal closed at the end of 2024, marking a significant addition to Mako’s growing industrial and infrastructure group. “Cascade’s service-focused company fits well with our existing operations,” said Mako’s CEO. “The addition of HDD services allows us to add underground and aerial high-speed fiber optic installations across the country.”
Reflecting on the process and their sourcing strategy, Mako’s CEO commented: “We’ve had an excellent experience using the Axial platform to find bolt-on opportunities for our business,” the CEO added. “Their sophisticated filtering engine enables me discover fresh prospects in a highly focused manner.”
Read the entire case study here.

Axial makes it easy for buyers to launch highly targeted add-on acquisition searches. With tools to define industry focus, deal size, geography, and portfolio context, buyers can efficiently communicate their criteria and get matched with relevant sell-side opportunities.
Whether sourcing on behalf of a portfolio company or as a standalone acquirer, setting up a buyside project—like the one shown above—helps streamline deal discovery and surface the right opportunities faster.
Today, we’re sharing a snapshot of add-on deal activity on Axial—and the types of buyers actively seeking these transactions.
The industries represented in this feature reflect the top 8 industries for add-ons – not 100% of all add-on projects on the platform.

Private Equity and Independent Sponsors represent 68.1% of the buyside add-on projects on Axial. To gain a deeper understanding of the types of deals these firms are seeking, we took a look into the industries and financial profiles of the sell-side opportunities PE and Independent Sponsors are pursuing.
| Industry | Share of Total | Revenue Range of Pursued Add-Ons | EBITDA Range of Pursued Add-Ons |
| Business Services | 11.1% | $1.5M - $28M | $520K - $8.3M |
| Consumer Goods | 8.7% | $1.6M - 36M | $587K - $6.5M |
| Financial Services | 1.4% | $4.2M - $19M | $670K - $4.4M |
| Food & Hospitality | 5.3% | $1.8M - $54M | $500K - $4.5M |
| Healthcare | 14.2% | $2.2M - $33M | $550K - $12.4M |
| Industrials | 39.8% | $1.6M - $57M | $560K - $10M |
| Technology | 13.8% | $1.6M - $30M | $590K -$5.4M |
| Transportation | 5.7% | $1.5M - $50M | $770K - $4.7M |
| $0.5M - $1M | $1M - $3M | $3M - $5M | $5M+ | |
| Business Services | 10.6% | 78.8% | 8.2% | 2.4% |
| Consumer Goods | 8.9% | 60.7% | 25% | 5.4% |
| Financial Services | 9.1% | 54.5% | 36.4% | --- |
| Food & Hospitality | 15.6% | 62.5% | 21.9% | --- |
| Healthcare | 10.8% | 70.6% | 14.7% | 3.9% |
| Industrials | 8% | 73.5% | 13.6% | 4.9% |
| Technology | 15.9% | 72.9% | 8.4% | 2.8% |
| Transportation | 10.5% | 73.7% | 15.8% | --- |
| Industry | Share of Total | Revenue Range of Pursued Add-Ons | Revenue Range of Pursued Add-Ons |
| Business Services | 8.1% | $1.5M - $16M | $670K - $3.1M |
| Consumer Goods | 11% | $4M - $28M | $530K - $5.5M |
| Financial Services | 1.6% | $4.3M - $7.5M | $860K - $3.2M |
| Food & Hospitality | 6.5% | $2.3M - 39M | $500K - $5.2M |
| Healthcare | 8.6% | $3.2M - $29M | $800K - $12M |
| Industrials | 50.5% | $2.2M - $52M | $520K - $10M |
| Technology | 8.6% | $1.2M - $25M | $520K - $2.8M |
| Transportation | 5.1% | $4.6M - $55M | $850K - $4.7M |
| $0.5M - $1M | $1M - $3M | $3M - $5M | $5M+ | |
| Business Services | 16.7% | 79.1% | 4.2% | --- |
| Consumer Goods | 16.1% | 71% | 12.9% | --- |
| Financial Services | 23.4% | 50% | 26.6% | --- |
| Food & Hospitality | 25% | 62.5% | --- | 12.5% |
| Healthcare | 4% | 64% | 24% | 8% |
| Industrials | 11.1% | 70.4% | 15.4% | 3.1% |
| Technology | 29% | 61.3% | 6.5% | 3.2% |
| Transportation | 7.1% | 78.6% | 14.3% | --- |
The data above offers insight into how Private Equity firms and Independent Sponsors may be approaching add-on acquisitions on Axial. While the Industrials sector is dominant for both groups (39.8% of Private Equity pursued add-ons and 50.5% for Independent Sponsors), PE appears more evenly distributed across sectors like Healthcare (14.2%), Technology (13.8%), and Business Services (11.1%). Independent sponsors, meanwhile, show a slight tilt in interest toward Consumer Goods (11%) alongside their Industrials focus.
When segmented by EBITDA range, both buyer types show a clear preference for $1M–$3M deals, but Independent Sponsors appear more willing to target smaller businesses. In several industries, a notable share of Independent Sponsor projects fall in the $500K–$1M EBITDA range—most notably in Technology (29%) and Food & Hospitality (25%). Private equity firms tend to pursue slightly larger EBITDA profiles across sectors and show more activity in the $3M+ range, particularly in Financial Services and Healthcare. These trends may reflect differences in fund structures, integration capacity, and value-creation strategies.
| Private Equity | Independent Sponsor | Family Office | Holding Company | Corporation | Individual Investor | |
| Business Services | 53.4% | 16.8% | 9.9% | 3.7% | 14.1% | 2% |
| Consumer Goods | 38.5% | 21% | 12.7% | 9.8% | 14.2% | 3.8% |
| Financial Services | 28.9% | 25.7% | 9.4% | 18.3% | 28.8% | 2.1% |
| Food & Hospitality | 53.7% | 25.3% | 7.4% | 3.2% | 8.5% | 2.1% |
| Healthcare | 61.4% | 14.9% | 9.3% | 5.1% | 7.9% | 1.4% |
| Industrials | 43.4% | 22.4% | 11.6% | 7.6% | 13.5% | 1.5% |
| Technology | 52.7% | 13.5% | 11% | 13.9% | 8.5% | 0.4% |
| Transportation | 43% | 17.9% | 10.7% | 14.3% | 12.4% | 1.7% |
Expanding beyond Private Equity and Independent Sponsors, the table above shows industry add-on concentration for all buyer types. The percentages reflect the share of buyers with add-on projects within each industry that belong to a given buyer type.
PE dominates the buyer mix across all industries, especially in Healthcare (61.4%). Independent sponsors are more prominent in Food & Hospitality (25.3%) and Financial Services (25.7%), potentially reflecting a focus on service-based, cash-flowing businesses.
Holding Companies and Family Offices tend to appear more consistently across industries, with modest concentrations in areas like Industrials and Consumer Goods, possibly reflecting long-term, thesis-driven acquisition strategies.
While Individual Investors represent a small share of total unique buyers on the platform, their add-on activity is most visible in Business Services and Consumer Goods—sectors that may offer simpler operating models, easier transitions, and lower capital requirements.
| $0.5M - $1M | $1M - $3M | $3M - $5M | $5M+ | |
| Private Equity | 12.2% | 70.3% | 14.1% | 3.4% |
| Independent Sponsor | 15.2% | 68.4% | 13.1% | 3.3% |
| Family Office | 10.1% | 66.9% | 20.8% | 2.2% |
| Holding Company | 17.9% | 60.9% | 17.2% | 4% |
| Corporation | 13.8% | 67.8% | 11.8% | 6.6% |
| Individual Investor | 30% | 63.4% | 3.3% | 3.3% |
Across all buyer types, the $1M–$3M EBITDA range remains the clear sweet spot for add-on acquisition pursuits on Axial. The $3M–$5M EBITDA range also sees meaningful pursuit—particularly among Family Offices and HoldCos—which may reflect a focus on slightly more mature businesses with stronger infrastructure in place. Meanwhile, Individual Investors show greater interest in sub-$1M deals, possibly reflecting leaner operating models or earlier-stage strategies.
![]()
Axial is the trusted deal platform serving the lower middle market ($2.5-$250M TEV).
Over 3,500 advisory firms and 3,000 corporate and financial buyers have joined Axial to efficiently connect with relevant capital partners, source actionable deals, and build new relationships.
Visit the Member Closed Deals page to see selected transactions that have been sourced and closed via Axial.