
Trustworthy Searchers, SBA Policy, and Underwriting ETA Investments w/ Grant Hensel
Today’s guest is Grant Hensel, founder of Entrepreneurial Capital, a fund that partners with self-funded searchers acquiring small businesses through…

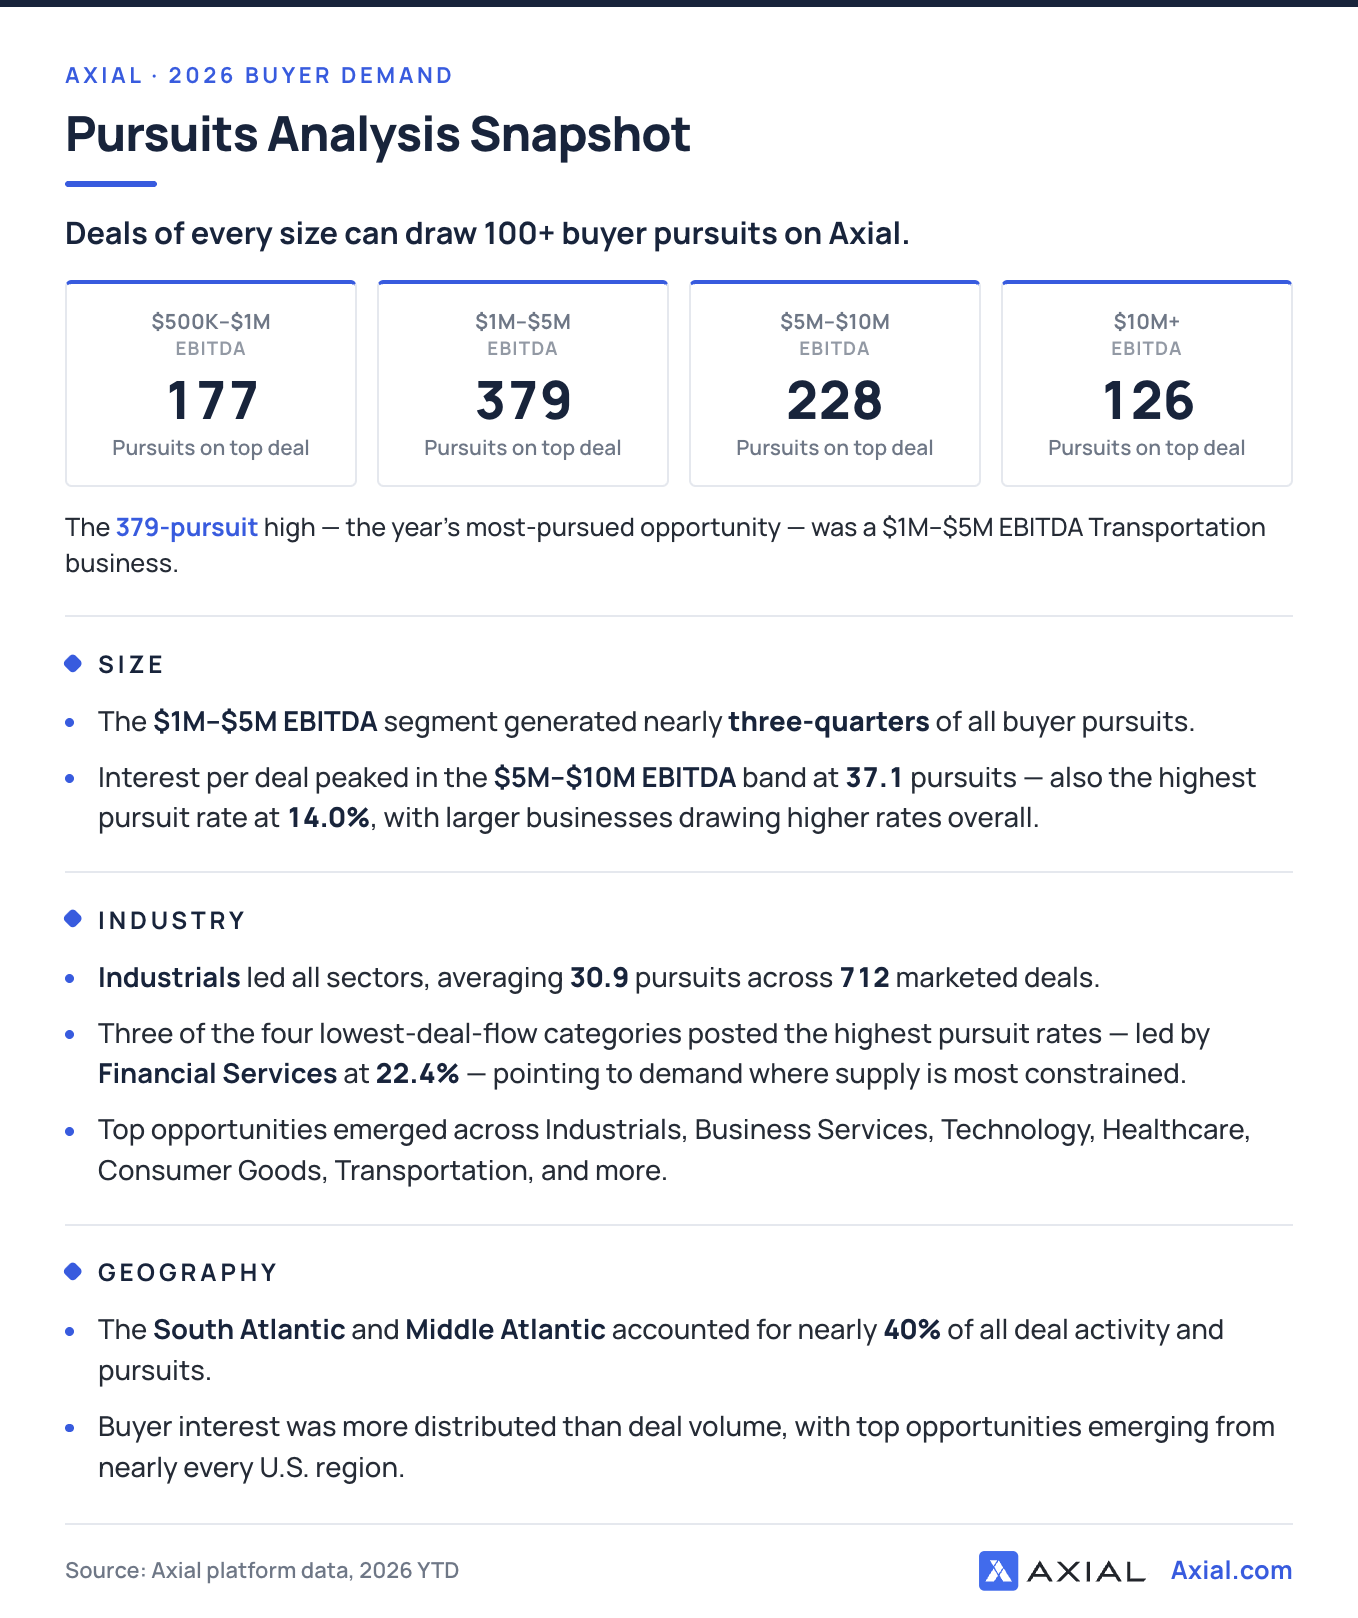
Every month, thousands of buyers on Axial actively review, pursue, and engage with lower middle market acquisition opportunities across a wide range of industries, business models, and size categories.
This report is designed to provide a transparent snapshot of where buyer attention is concentrated in the market today, based not on surveys, market commentary, or anecdotal conversations, but on actual buyer pursuit activity occurring on the Axial platform.
For the uninitiated, a pursuit refers to the action of a prospective buyer expressing explicit, top-of-the-funnel interest in a specific deal that an advisor has shared with them on the platform. It tracks buyer interest in available assets as soon as a deal goes to market. It’s akin to a Nielsen rating that tracks the targets prospective buyers are “watching” and increases as interested parties request additional information. If NDAs, IOIs, and LOIs reflect the progression of interest among dealmakers, pursuits offer insights into the very first impulses of prospective buyers.
The data below includes the pursuit activity on deals marketed through Axial thus far year-to-date in 2026. It highlights a selection of opportunities that generated meaningful buyer engagement across industries, regions, and EBITDA bands, ranging from sub-$1M EBITDA businesses to scaled $10M+ EBITDA platforms.
To preserve confidentiality while still surfacing useful patterns, company descriptions and headlines have been anonymized and grouped into standardized revenue, EBITDA, and margin bands.
Our goal with these reports is to provide business owners, M&A advisors, and investors with a more grounded understanding of how real acquisition demand is behaving across the lower middle market.
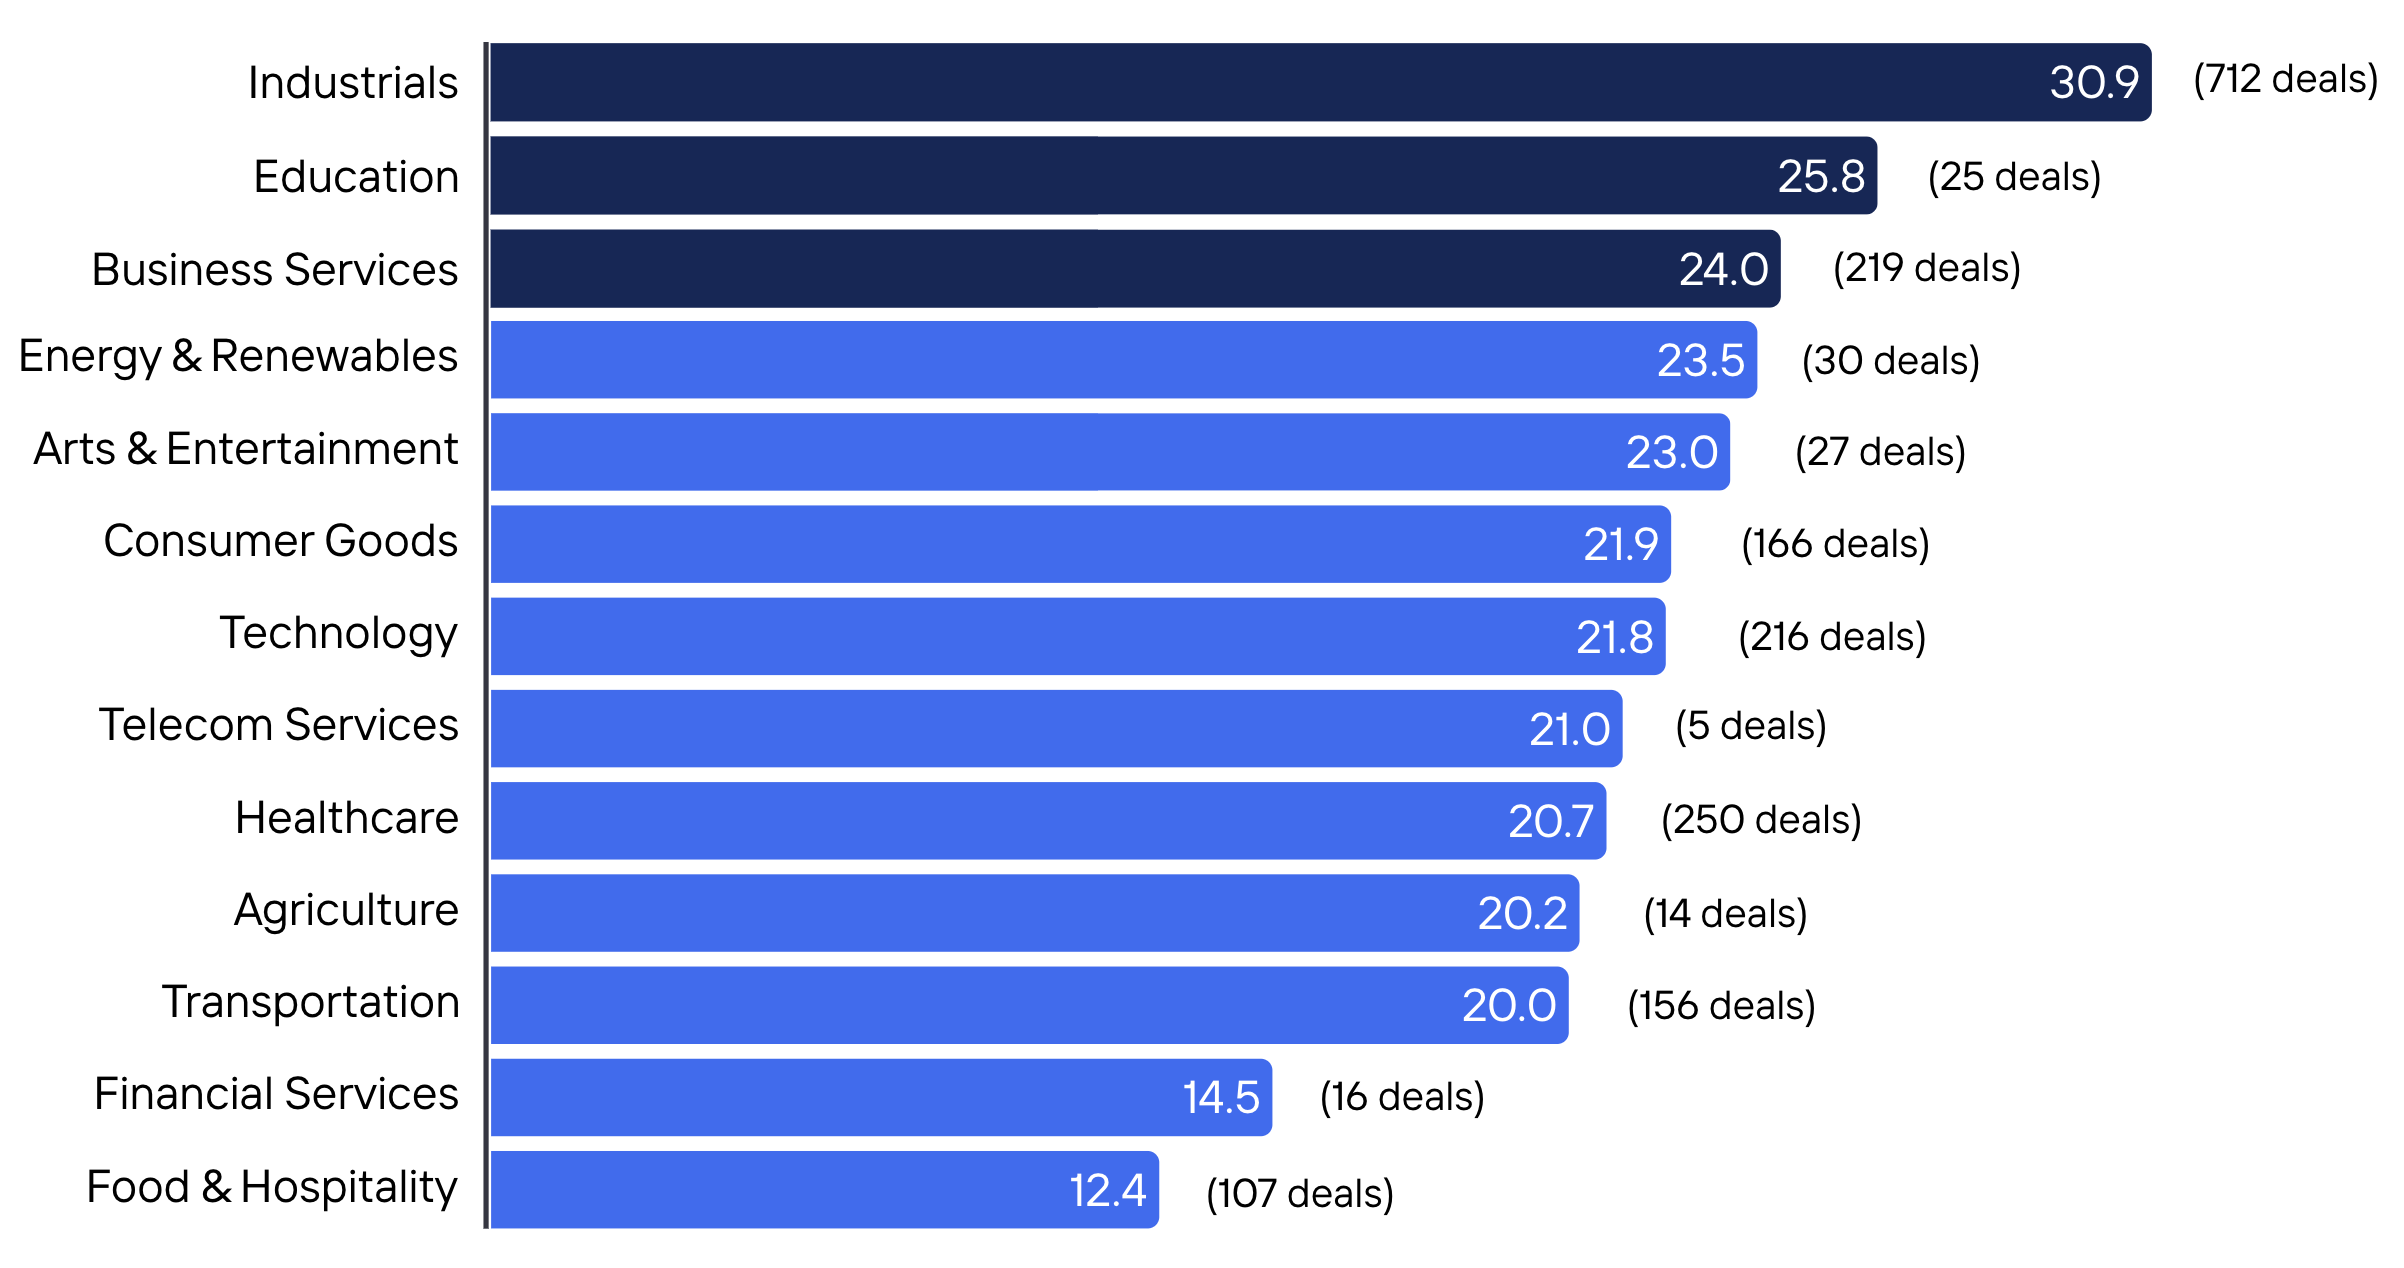
Industrials generated the highest average buyer interest in the dataset, with the average deal receiving 30.9 pursuits across 712 marketed opportunities. Education ranked second at 25.8 pursuits per deal, though only 25 education businesses were marketed during the period. Business Services also generated strong engagement, averaging 24.0 pursuits across 219 opportunities.
Beyond the top-ranked sectors, buyer interest was relatively consistent across much of the market, with most major industries generating between 20 and 25 pursuits per deal.
–
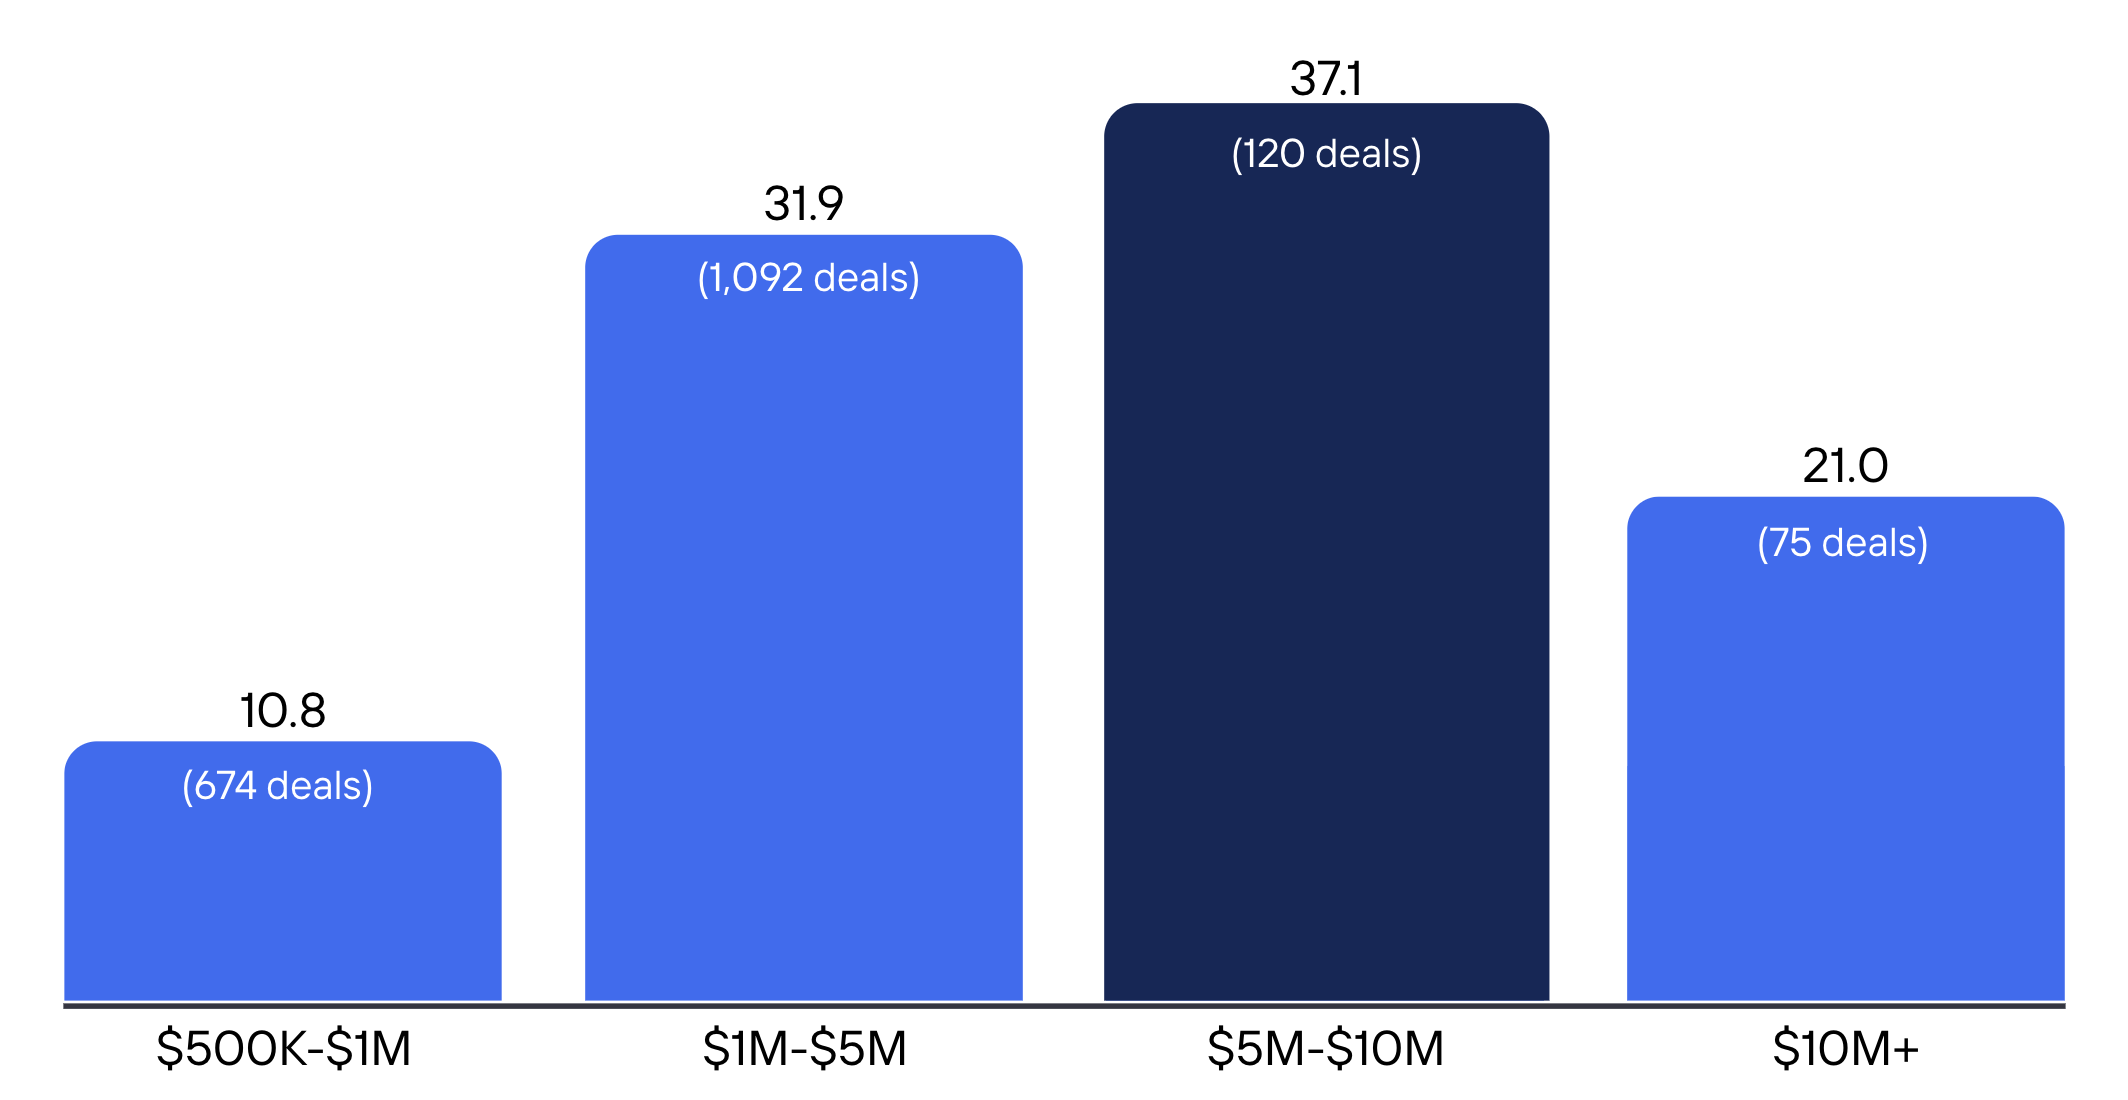
The $1M-$5M EBITDA segment accounted for the largest share of buyer demand on Axial during the period. The 1,092 marketed opportunities in this band generated 34,784 pursuits, representing approximately 72% of all buyer pursuits in the dataset.
Looking at pursuits on a per-deal basis provides additional context. While the $1M-$5M segment averaged 31.9 pursuits per deal, businesses generating $5M-$10M of EBITDA averaged 37.1 pursuits per deal, the highest of any EBITDA band. By comparison, sub-$1M EBITDA businesses averaged 10.8 pursuits per deal, while $10M+ opportunities averaged 21.0 pursuits per deal.
| Rank | Industry | Revenue | EBITDA | EBITDA Margin | Buyer Interest Generated |
|---|---|---|---|---|---|
| 1 | Transportation | $10-25M | $1-5M | 20-30% | 379 |
| 2 | Business Services | $10-25M | $1-5M | 30-50% | 281 |
| 3 | Industrials | $10-25M | $1-5M | 20-30% | 257 |
| 4 | Consumer Goods | $25-50M | $5-10M | 10-20% | 228 |
| 5 | Industrials | $10-25M | $5-10M | 20-30% | 223 |
| 6 | Industrials | $5-10M | $1-5M | 50-75% | 209 |
| 7 | Industrials | $5-10M | $1-5M | 30-50% | 206 |
| 8 | Arts & Entertainment | $5-10M | $1-5M | 30-50% | 206 |
| 9 | Industrials | $10-25M | $1-5M | 30-50% | 203 |
| 10 | Industrials | $10-25M | $1-5M | 20-30% | 197 |
| 11 | Agriculture | $5-10M | $1-5M | 30-50% | 190 |
| 12 | Consumer Goods | $10-25M | $1-5M | 20-30% | 178 |
| 13 | Industrials | $10-25M | $500K-1M | <10% | 177 |
| 14 | Education | $5-10M | $1-5M | 30-50% | 177 |
| 15 | Industrials | $10-25M | $1-5M | 10-20% | 175 |
| 16 | Industrials | $5-10M | $1-5M | 20-30% | 173 |
| 17 | Technology | $10-25M | $1-5M | 20-30% | 173 |
| 18 | Industrials | $10-25M | $1-5M | 30-50% | 173 |
| 19 | Industrials | $5-10M | $1-5M | 20-30% | 169 |
| 20 | Industrials | $5-10M | $1-5M | 35-40% | 167 |
| 21 | Consumer Goods | $25-50M | $5-10M | 10-15% | 167 |
| 22 | Industrials | $1-5M | $500K-1M | 25-30% | 165 |
| 23 | Industrials | $25-50M | $1-5M | 10-15% | 161 |
| 24 | Industrials | $10-25M | $1-5M | 20-25% | 161 |
| 25 | Energy & Renewables | $10-25M | $5-10M | 30-35% | 161 |
While total pursuits measure the volume of buyer interest generated by a deal, pursuit rate offers a different perspective. Rather than focusing on the number of pursuits alone, pursuit rate measures the percentage of invited buyers who elected to pursue an opportunity. As a result, it can help identify deals and market segments that generated particularly strong buyer engagement relative to the size of their invited audience.
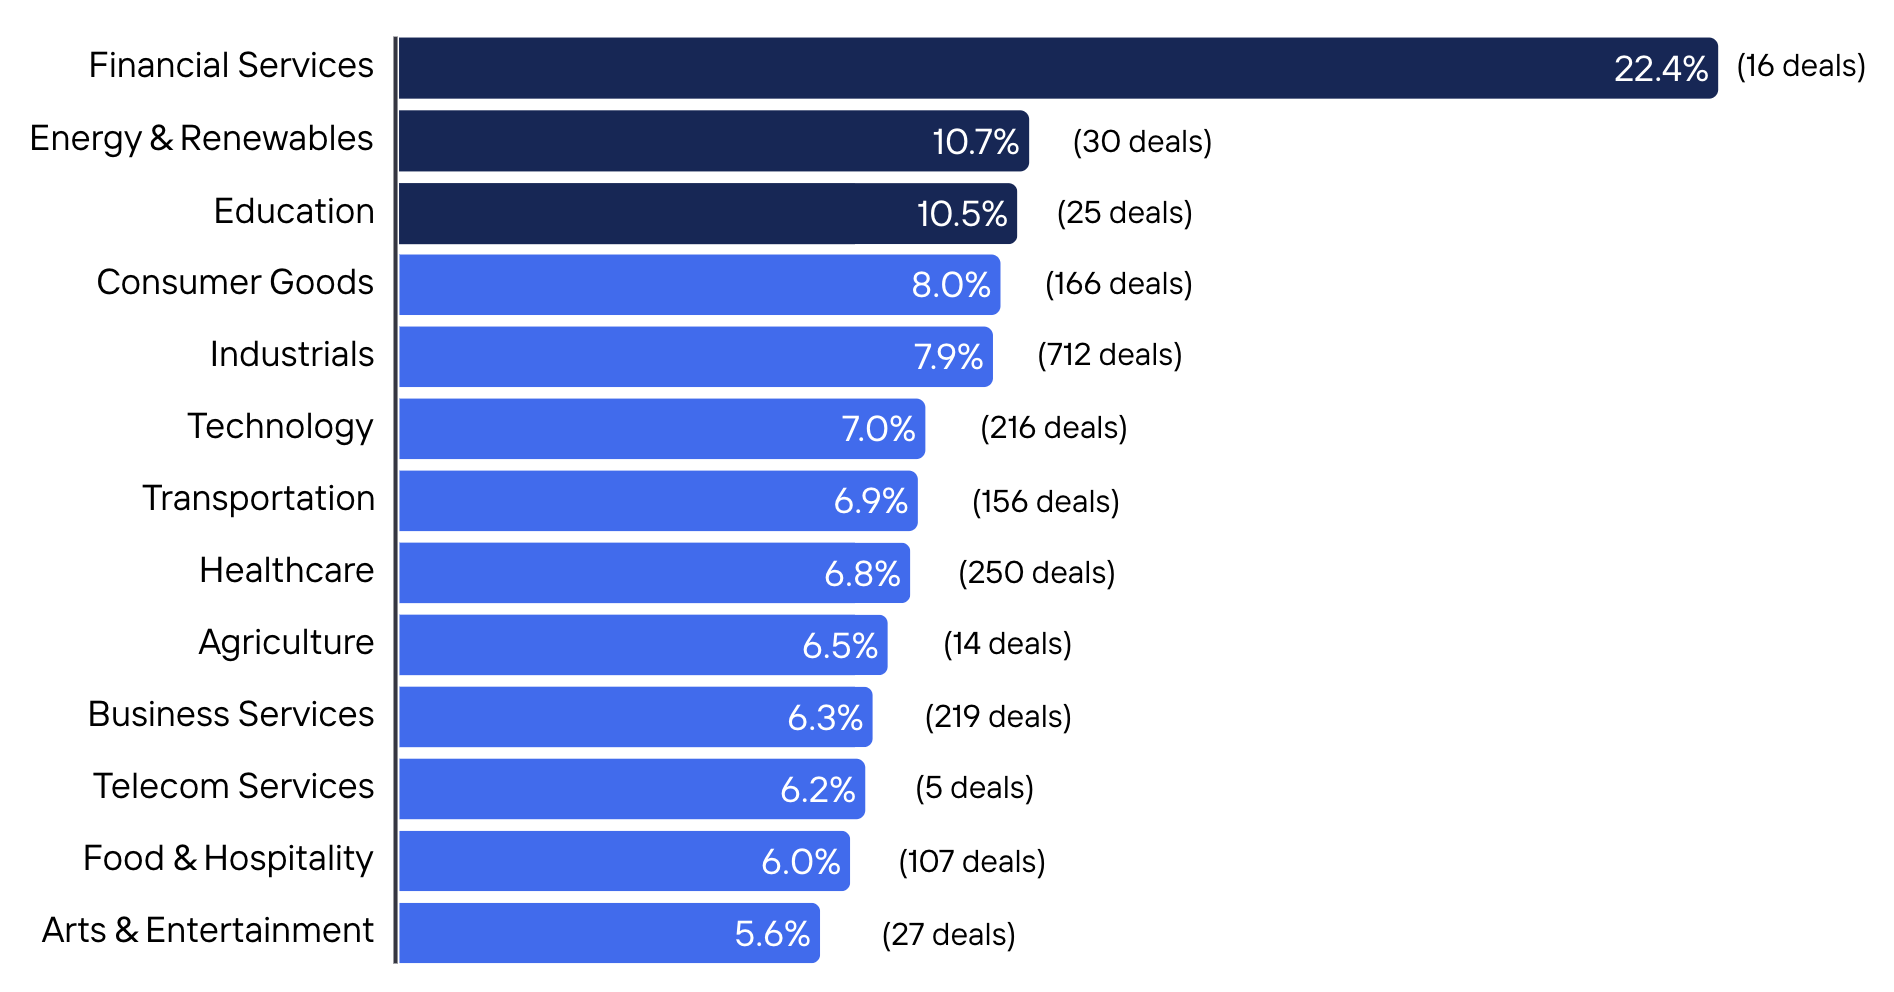
Pursuit rates were generally highest among a handful of smaller industry categories. Financial Services recorded the highest pursuit rate at 22.4%, but across a relatively small group of 16 marketed opportunities. Energy & Renewables and Education also ranked near the top, each posting pursuit rates above 10%. Beyond those categories, pursuit rates were relatively consistent across the market, with most industries falling between 6% and 8%.
The table below features the 25 highest-ranking opportunities by pursuit rate among deals sent to at least 50 recipients, providing additional context on the deals that generated the strongest buyer engagement relative to the number of buyers invited to consider them.
| Rank | Industry | Revenue | EBITDA | EBITDA Margin | Recipients | Pursuits | Pursuit Rate |
|---|---|---|---|---|---|---|---|
| 1 | Transportation | $25-50M | $5-10M | 20-30% | 74 | 34 | 46.0% |
| 2 | Food & Hospitality | $1-5M | $1-5M | 30-50% | 79 | 35 | 44.3% |
| 3 | Energy & Renewables | $10-25M | $1-5M | 10-20% | 60 | 26 | 43.3% |
| 4 | Transportation | $25-50M | $5-10M | 10-20% | 110 | 47 | 42.7% |
| 5 | Industrials | $5-10M | $1-5M | 20-30% | 92 | 38 | 41.3% |
| 6 | Industrials | $5-10M | $1-5M | 30-50% | 134 | 50 | 37.3% |
| 7 | Technology | $5-10M | $1-5M | 20-30% | 68 | 25 | 36.8% |
| 8 | Industrials | $5-10M | $1-5M | 10-20% | 131 | 48 | 36.6% |
| 9 | Industrials | $5-10M | $1-5M | 10-20% | 335 | 121 | 36.1% |
| 10 | Industrials | $5-10M | $1-5M | 10-20% | 111 | 39 | 35.1% |
| 11 | Education | $5-10M | $1-5M | 20-30% | 121 | 42 | 34.7% |
| 12 | Transportation | $5-10M | $1-5M | 10-20% | 114 | 39 | 34.2% |
| 13 | Business Services | $10-25M | $1-5M | 30-50% | 154 | 51 | 33.1% |
| 14 | Consumer Goods | $50-100M | $5-10M | 10-20% | 93 | 30 | 32.3% |
| 15 | Industrials | $10-25M | $1-5M | 10-20% | 543 | 175 | 32.2% |
| 16 | Industrials | $10-25M | $1-5M | 20-30% | 61 | 19 | 31.1% |
| 17 | Technology | $25-50M | $5-10M | 20-30% | 55 | 17 | 30.9% |
| 18 | Industrials | $5-10M | $1-5M | 10-20% | 82 | 25 | 30.5% |
| 19 | Transportation | $5-10M | $1-5M | 20-30% | 95 | 28 | 29.5% |
| 20 | Technology | $1-5M | $1-5M | 50-70% | 169 | 49 | 29.0% |
| 21 | Industrials | $25-50M | $5-10M | 10-20% | 72 | 20 | 27.8% |
| 22 | Healthcare | $25-50M | $5-10M | 20-30% | 339 | 94 | 27.7% |
| 23 | Business Services | $5-10M | $1-5M | 20-30% | 188 | 51 | 27.1% |
| 24 | Industrials | $10-25M | $5-10M | 30-50% | 85 | 23 | 27.1% |
| 25 | Technology | $10-25M | $5-10M | 20-30% | 88 | 23 | 26.1% |
Buyer interest can vary significantly across different segments. To provide additional context, the tables below feature the 10 most pursued deals within four EBITDA bands, ranging from businesses generating $500K–$1M of EBITDA to those exceeding $10M. Together, these rankings offer a more detailed view of the opportunities that attracted the greatest buyer interest within each category.
| Rank | Industry | Revenue | EBITDA | EBITDA Margin | Buyer Interest Generated |
|---|---|---|---|---|---|
| 1 | Technology | $50-100M | $10-25M | 10-20% | 126 |
| 2 | Education | $25-50M | $10-25M | 30-50% | 102 |
| 3 | Industrials | $50-100M | $10-25M | 10-20% | 101 |
| 4 | Healthcare | $25-50M | $10-25M | 30-50% | 93 |
| 5 | Transportation | $50-100M | $10-25M | 20-30% | 68 |
| 6 | Transportation | $25-50M | $10-25M | 50-75% | 67 |
| 7 | Healthcare | $10-25M | $10-25M | 50-75% | 60 |
| 8 | Energy & Renewables | $50-$100M | $10-25M | 20-30% | 46 |
| 9 | Industrials | $100-$150M | $10-25M | <10% | 42 |
| 10 | Transportation | $25-50M | $10-25M | 30-50% | 37 |
–
| Rank | Industry | Revenue | EBITDA | EBITDA Margin | Buyer Interest Generated |
|---|---|---|---|---|---|
| 1 | Consumer Goods | $25-50M | $5-10M | 10-20% | 228 |
| 2 | Industrials | $10-25M | $5-10M | 20-30% | 223 |
| 3 | Consumer Goods | $25-50M | $5-10M | 10-20% | 167 |
| 4 | Industrials | $10-25M | $5-10M | 20-30% | 161 |
| 5 | Energy & Renewables | $10-25M | $5-10M | 30-50% | 161 |
| 6 | Industrials | $25-50M | $5-10M | 20-30% | 139 |
| 7 | Healthcare | $10-25M | $5-10M | 50-75% | 135 |
| 8 | Industrials | $10-25M | $5-10M | 30-50% | 133 |
| 9 | Industrials | $10-25M | $5-10M | 30-50% | 112 |
| 10 | Industrials | $25-50M | $5-10M | 10-20% | 97 |
–
| Rank | Industry | Revenue | EBITDA | EBITDA Margin | Buyer Interest Generated |
|---|---|---|---|---|---|
| 1 | Transportation | $10-25M | $1-5M | 20-30% | 379 |
| 2 | Business Services | $10-25M | $1-5M | 30-50% | 281 |
| 3 | Industrials | $10-25M | $1-5M | 20-30% | 257 |
| 4 | Industrials | $5-10M | $1-5M | 50-75% | 209 |
| 5 | Industrials | $5-10M | $1-5M | 30-50% | 206 |
| 6 | Arts & Entertainment | $5-10M | $1-5M | 35-40% | 206 |
| 7 | Industrials | $10-25M | $1-5M | 30-50% | 203 |
| 8 | Industrials | $10-25M | $1-5M | 20-30% | 197 |
| 9 | Agriculture | $5-10M | $1-5M | 30-50% | 190 |
| 10 | Consumer Goods | $10-25M | $1-5M | 20-30% | 178 |
–
| Rank | Industry | Revenue | EBITDA | EBITDA Margin | Buyer Interest Generated |
|---|---|---|---|---|---|
| 1 | Industrials | $10-25M | $500K-1M | <10% | 177 |
| 2 | Industrials | $1-5M | $500K-1M | 20-30% | 165 |
| 3 | Industrials | $1-5M | $500K-1M | 20-30% | 142 |
| 4 | Industrials | $1-5M | $500K-1M | 20-30% | 99 |
| 5 | Industrials | $5-10M | $500K-1M | 10-20% | 85 |
| 6 | Industrials | $1-5M | $500K-1M | 10-20% | 82 |
| 7 | Food & Hospitality | $1-5M | $500K-1M | 20-30% | 81 |
| 8 | Industrials | $1-5M | $500K-1M | 20-30% | 75 |
| 9 | Industrials | $1-5M | $500K-1M | 20-30% | 73 |
| 10 | Technology | $5-10M | $500K-1M | 10-20% | 72 |
The tables below feature the five most pursued deals within each major industry category. The rankings span a diverse range of business types and financial profiles, providing additional context on the opportunities that generated the strongest buyer interest within their respective sectors and how buyer engagement varied across industries.
| Rank | Revenue | EBITDA | EBITDA Margin | Buyer Interest Generated |
|---|---|---|---|---|
| 1 | $10-25M | $1-5M | 20-30% | 257 |
| 2 | $10-25M | $5-10M | 20-30% | 223 |
| 3 | $5-10M | $1-5M | 50-75% | 209 |
| 4 | $5-10M | $1-5M | 30-50% | 206 |
| 5 | $10-25M | $1-5M | 30-50% | 203 |
| Rank | Revenue | EBITDA | EBITDA Margin | Buyer Interest Generated |
|---|---|---|---|---|
| 1 | $25-50M | $1-5M | 10-20% | 139 |
| 2 | $10-25M | $5-10M | 50-75% | 135 |
| 3 | $5-10M | $1-5M | 20-30% | 127 |
| 4 | $25-50M | $5-10M | 20-30% | 94 |
| 5 | $25-50M | $10-25M | 30-50% | 93 |
| Rank | Revenue | EBITDA | EBITDA Margin | Buyer Interest Generated |
|---|---|---|---|---|
| 1 | $10-25M | $1-5M | 30-50% | 281 |
| 2 | $1-5M | $1-5M | 30-50% | 129 |
| 3 | $5-10M | $1-5M | 50-75% | 126 |
| 4 | $1-5M | $1-5M | 50-75% | 120 |
| 5 | $1-5M | $1-5M | 50-75% | 114 |
| Rank | Revenue | EBITDA | EBITDA Margin | Buyer Interest Generated |
|---|---|---|---|---|
| 1 | $10-25M | $1-5M | 20-30% | 173 |
| 2 | $5-10M | $1-5M | 30-50% | 150 |
| 3 | $10-25M | $1-5M | 10-20% | 139 |
| 4 | $5-10M | $1-5M | 10-20% | 132 |
| 5 | $50-100M | $10-25M | 10-20% | 126 |
| Rank | Revenue | EBITDA | EBITDA Margin | Buyer Interest Generated |
|---|---|---|---|---|
| 1 | $25-50M | $5-10M | 10-20% | 228 |
| 2 | $10-25M | $1-5M | 20-30% | 178 |
| 3 | $25-50M | $5-10M | 10-20% | 167 |
| 4 | $25-50M | $1-5M | 10-20% | 145 |
| 5 | $5-10M | $1-5M | 20-30% | 102 |
| Rank | Revenue | EBITDA | EBITDA Margin | Buyer Interest Generated |
|---|---|---|---|---|
| 1 | $10-25M | $1-5M | 20-30% | 379 |
| 2 | $10-25M | $1-5M | 20-30% | 102 |
| 3 | $10-25M | $5-10M | 20-30% | 83 |
| 4 | $25-50M | $1-5M | 10-20% | 79 |
| 5 | $10-25M | $1-5M | <10% | 78 |
| Rank | Revenue | EBITDA | EBITDA Margin | Buyer Interest Generated |
|---|---|---|---|---|
| 1 | $5-10M | $1-5M | 30-50% | 146 |
| 2 | $1-5M | $500K-1M | 20-30% | 81 |
| 3 | $25-50M | $1-5M | <10% | 63 |
| 4 | $5-10M | $1-5M | 20-30% | 60 |
| 5 | $5-10M | $500K-1M | 10-20% | 45 |
| Rank | Revenue | EBITDA | EBITDA Margin | Buyer Interest Generated |
|---|---|---|---|---|
| 1 | $10-25M | $5-10M | 30-50% | 161 |
| 2 | $10-25M | $1-5M | 10-20% | 85 |
| 3 | $10-25M | $5-10M | 50-75% | 62 |
| 4 | $50-100M | $10-25M | 20-30% | 46 |
| 5 | $25-50M | $5-10M | 10-20% | 36 |
| Rank | Revenue | EBITDA | EBITDA Margin | Buyer Interest Generated |
|---|---|---|---|---|
| 1 | $5-10M | $1-5M | 30-50% | 206 |
| 2 | $10-25M | $5-10M | 30-50% | 65 |
| 3 | $10-25M | $5-10M | 30-50% | 59 |
| 4 | $10-25M | $5-10M | 30-50% | 48 |
| 5 | $10-25M | $1-5M | 30-50% | 38 |
| Rank | Revenue | EBITDA | EBITDA Margin | Buyer Interest Generated |
|---|---|---|---|---|
| 1 | $5-10M | $1-5M | 30-50% | 177 |
| 2 | $25-50M | $10-25M | 30-50% | 102 |
| 3 | $5-10M | $1-5M | 20-30% | 45 |
| 4 | $5-10M | $1-5M | 20-30% | 44 |
| 5 | $5-10M | $1-5M | 20-30% | 42 |
| Rank | Revenue | EBITDA | EBITDA Margin | Buyer Interest Generated |
|---|---|---|---|---|
| 1 | $5-10M | $1-5M | 30-50% | 57 |
| 2 | $1-5M | $1-5M | 50-75% | 31 |
| 3 | $1-5M | $1-5M | 50-75% | 28 |
| 4 | $1-5M | $500K-1M | 20-30% | 23 |
| 5 | $50-100M | $10-25M | 20-30% | 14 |
| Rank | Revenue | EBITDA | EBITDA Margin | Buyer Interest Generated |
|---|---|---|---|---|
| 1 | $5-10M | $1-5M | 30-50% | 190 |
| 2 | $25-50M | $1-5M | <10% | 21 |
| 3 | $5-10M | $1-5M | 10-20% | 16 |
| 4 | $1-5M | $500K-1M | 20-30% | 12 |
| 5 | $1-5M | $500K-1M | 30-50% | 8 |
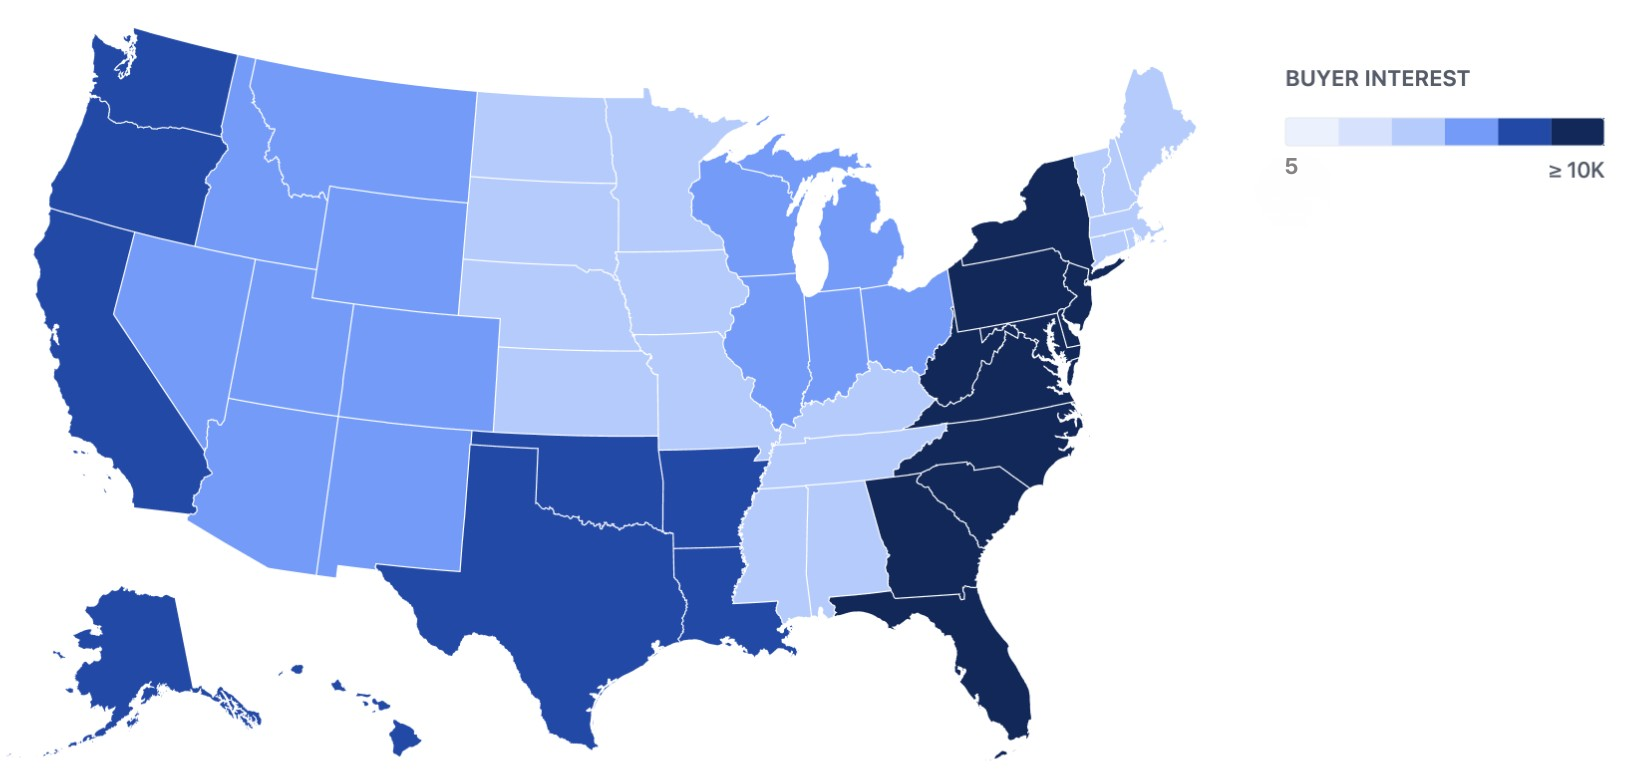
The South Atlantic and Middle Atlantic regions together accounted for nearly 40% of YTD activity by both deal count and total pursuits. The Pacific, West South Central, and Eastern Midwest formed a clear second tier. Less obvious from the rankings is that buyer interest was more geographically distributed than deal volume. Even smaller-volume regions such as East South Central and the Northeast produced individual opportunities that ranked among the top 25 for total buyer interest in the dataset. The tables below feature the five most pursued deals within each region.
| Rank | Industry | Revenue | EBITDA | EBITDA Margin | Buyer Interest Generated |
|---|---|---|---|---|---|
| 1 | Industrials | $10-25M | $1-5M | 20-30% | 257 |
| 2 | Arts & Entertainment | $5-10M | $1-5M | 30-50% | 206 |
| 3 | Industrials | $10-25M | $1-5M | 30-50% | 203 |
| 4 | Industrials | $10-25M | $500K-1M | <10% | 177 |
| 5 | Industrials | $10-25M | $1-5M | 10-20% | 175 |
| Rank | Industry | Revenue | EBITDA | EBITDA Margin | Buyer Interest Generated |
|---|---|---|---|---|---|
| 1 | Consumer Goods | $25-50M | $5-10M | 10-20% | 228 |
| 2 | Industrials | $10-25M | $5-10M | 20-30% | 223 |
| 3 | Industrials | $10-25M | $1-5M | 30-50% | 173 |
| 4 | Consumer Goods | $25-50M | $5-10M | 10-20% | 167 |
| 5 | Industrials | $10-25M | $5-10M | 30-50% | 133 |
| Rank | Industry | Revenue | EBITDA | EBITDA Margin | Buyer Interest Generated |
|---|---|---|---|---|---|
| 1 | Industrials | $25-50M | $1-5M | 20-30% | 197 |
| 2 | Technology | $10-25M | $1-5M | 20-30% | 173 |
| 3 | Industrials | $5-10M | $1-5M | 30-50% | 167 |
| 4 | Industrials | $25-50M | $1-5M | 10-20% | 161 |
| 5 | Industrials | $5-10M | $1-5M | 10-20% | 149 |
| Rank | Industry | Revenue | EBITDA | EBITDA Margin | Buyer Interest Generated |
|---|---|---|---|---|---|
| 1 | Education | $5-10M | $1-5M | 30-50% | 177 |
| 2 | Industrials | $5-10M | $1-5M | 20-30% | 169 |
| 3 | Energy & Renewables | $10-25M | $5-10M | 30-50% | 161 |
| 4 | Technology | $5-10M | $1-5M | 30-50% | 150 |
| 5 | Industrials | $25-50M | $1-5M | 10-20% | 142 |
| Rank | Industry | Revenue | EBITDA | EBITDA Margin | Buyer Interest Generated |
|---|---|---|---|---|---|
| 1 | Business Services | $10-25M | $1-5M | 30-50% | 281 |
| 2 | Industrials | $5-10M | $1-5M | 30-50% | 206 |
| 3 | Industrials | $1-5M | $500K-1M | 20-30% | 142 |
| 4 | Healthcare | $25-50M | $1-5M | 10-20% | 139 |
| 5 | Healthcare | $5-10M | $1-5M | 20-30% | 127 |
| Rank | Industry Vertical | Revenue Band | EBITDA Band | EBITDA Margin Band | Buyer Interest Generated |
|---|---|---|---|---|---|
| 1 | Transportation | $25-50M | $1-5M | 20-30% | 379 |
| 2 | Industrials | $5-10M | $1-5M | 50-75% | 209 |
| 3 | Agriculture | $5-10M | $1-5M | 30-50% | 190 |
| 4 | Consumer Goods | $10-25M | $1-5M | 20-30% | 178 |
| 5 | Industrials | $25-50M | $5-10M | 20-30% | 161 |
| Rank | Industry | Revenue | EBITDA | EBITDA Margin | Buyer Interest Generated |
|---|---|---|---|---|---|
| 1 | Industrials | $5-10M | $1-5M | 20-30% | 130 |
| 2 | Industrials | $5-10M | $1-5M | 10-20% | 121 |
| 3 | Technology | $10-25M | $1-5M | 10-20% | 120 |
| 4 | Industrials | $25-50M | $1-5M | <10% | 99 |
| 5 | Industrials | $5-10M | $1-5M | 30-50% | 90 |
| Rank | Industry | Revenue | EBITDA | EBITDA Margin | Buyer Interest Generated |
|---|---|---|---|---|---|
| 1 | Business Services | $1-5M | $1-5M | 50-75% | 114 |
| 2 | Industrials | $5-10M | $1-5M | 30-50% | 98 |
| 3 | Industrials | $5-10M | $1-5M | 10-20% | 87 |
| 4 | Industrials | $10-25M | $1-5M | 20-30% | 68 |
| 5 | Healthcare | $5-10M | $1-5M | 30-50% | 64 |
| Rank | Industry | Revenue | EBITDA | EBITDA Margin | Buyer Interest Generated |
|---|---|---|---|---|---|
| 1 | Business Services | $1-5M | $1-5M | 50-75% | 114 |
| 2 | Industrials | $5-10M | $1-5M | 30-50% | 98 |
| 3 | Industrials | $5-10M | $1-5M | 20-30% | 87 |
| 4 | Industrials | $10-25M | $1-5M | 10-20% | 68 |
| 5 | Healthcare | $5-10M | $1-5M | 30-50% | 64 |
The Spring 2026 Pursuits Report highlights a lower middle market that is active across a wide range of industries, geographies, and company profiles. While buyer interest was concentrated in certain segments – particularly businesses with EBITDA ranges between $1M and $10M – strong buyer interest was not limited to any single industry, region, or deal type.
Across the dataset, buyer interest was concentrated in certain areas while remaining broadly distributed across the market. Highly pursued opportunities emerged across a range of industries, EBITDA bands, and geographic regions, reinforcing the value of examining buyer demand through multiple lenses.
As always, buyer interest is only one indicator of market activity. However, pursuit behavior provides a useful early signal of where acquisition demand is forming and which opportunities are generating outsized interest.
We hope these findings provide business owners, advisors, and investors with additional perspective on how buyers are engaging with opportunities in today’s market.